Welcome readers! In this first issue of Inferred, our nascent data newsletter, we’ll look at the dynamics between the two headline American labs rumored to be hurtling towards IPOs and the wider model market.
Remember: this whole pie is growing fast
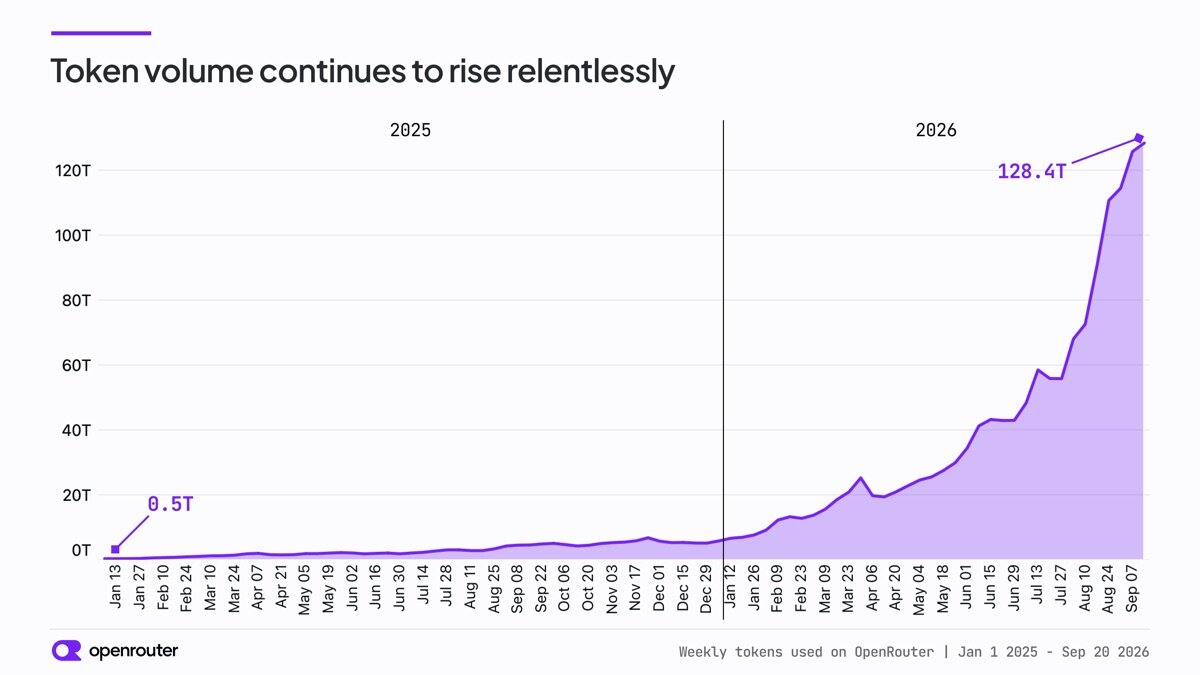
Weekly token volume on OpenRouter went from 0.5 trillion in the week of Jan 13, 2025 to 128.4 trillion in the week of Sep 14, 2026. Roughly a 250x increase in 20 months.
If you zoom into any granular point along the way, the curve is not smooth. It’s riddled with discounts, stealth model launches, and massive underlying capability improvements. But the introduction of real, powerful, autonomous(ish) agents has propelled this market to new heights. We estimate the last day humans used more tokens than agents was Feb 6, 2026.
Let’s take a look at the back-and-forth between the two most prominent American labs.
On the American frontier
OpenAI reaches spend parity with Anthropic
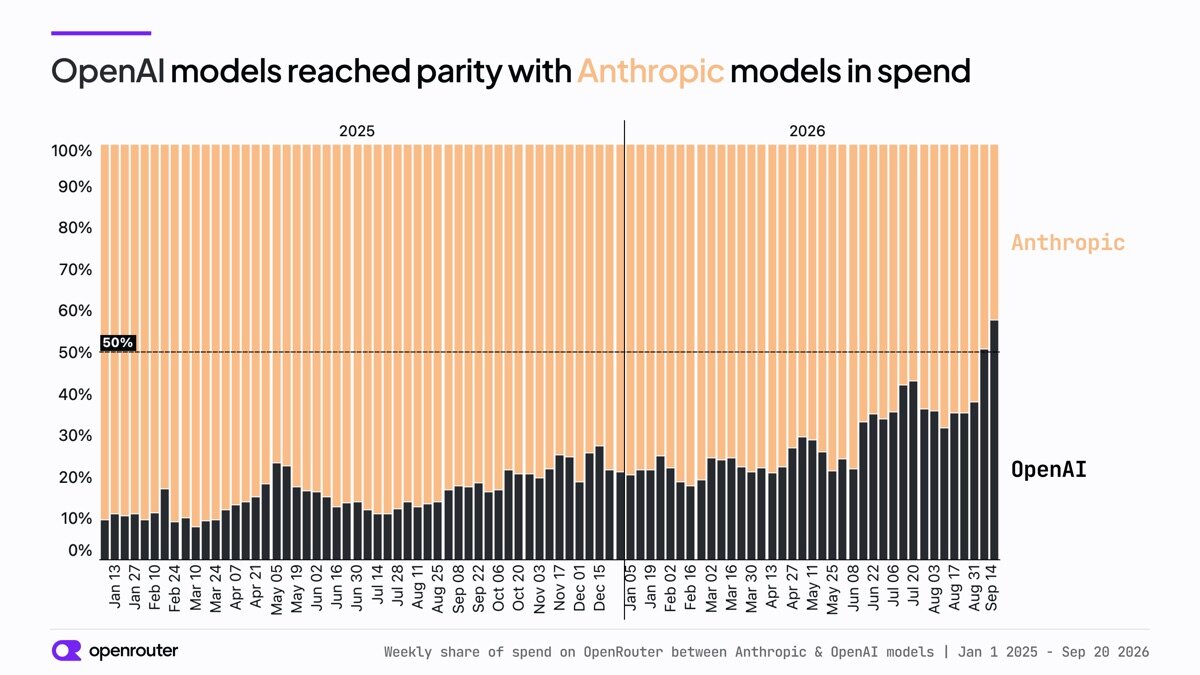
In the week of Sep 7, 2026, OpenAI models took just over 50% of combined spend between the two labs. That is the first week at or above the 50% line since the week of Feb 24, 2024. OpenAI then followed that up with another strong week last week.
This is a significant shift. OpenAI sat near 10% of combined spend through early 2025, climbed into the 20s by late 2025, and hovered in the low-to-mid 20s through the first half of this year. The step change of summer 2026 came on the back of some well-received model releases, in particular the GPT 5.6 family.
In tokens, OpenAI leads by a wide margin
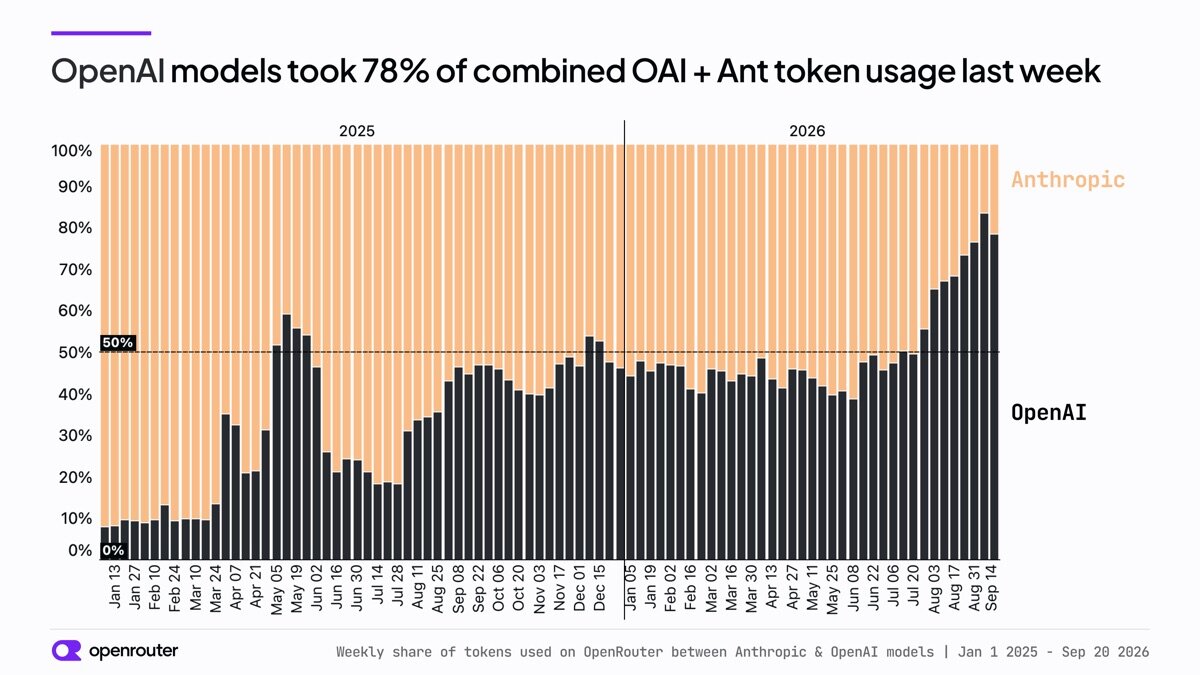
Spend parity understates OpenAI's position on volume. Measured in tokens, OpenAI models took 78% of combined OpenAI and Anthropic usage in the week of Sep 14.
The token chart has a longer history of swings than the spend chart. OpenAI spiked to nearly 60% in May 2025, fell back below 20% by July, and then spent most of the year from August 2025 through June 2026 in a 40% to 50% band. The current run started at the same late June inflection point and has climbed every week since late July, from roughly 55% to above 80%.
Where the spend is going: Astra and the GPT 5.6 family
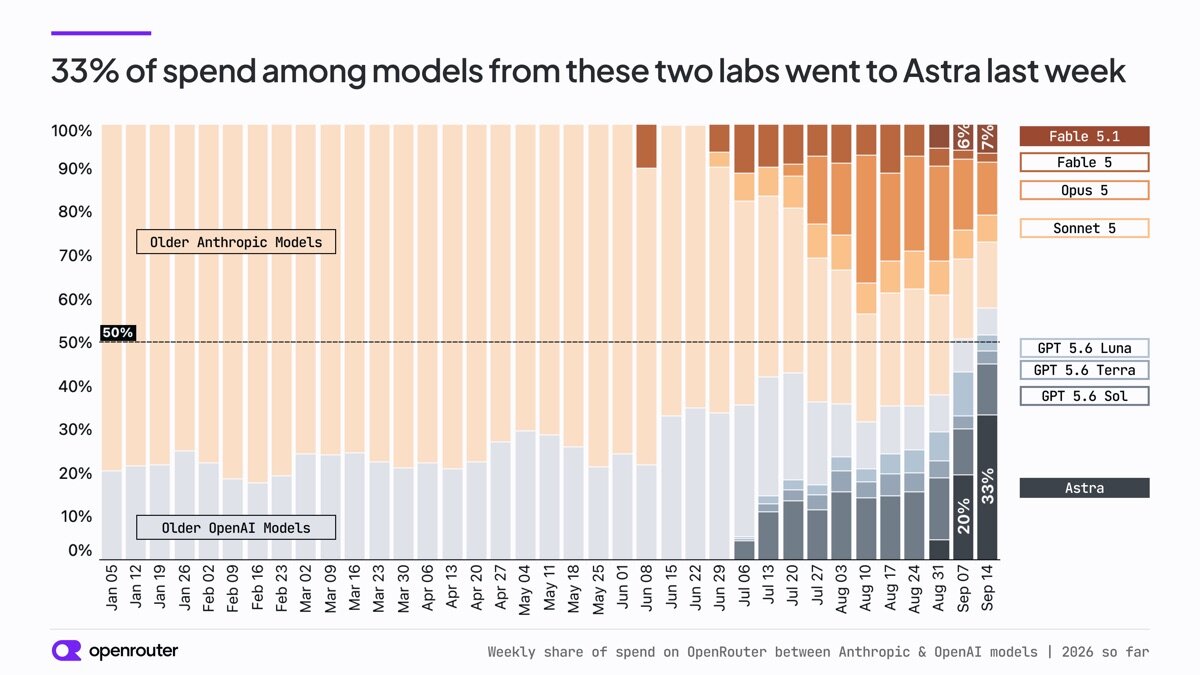
Astra, OpenAI's newest premium model, took one-third of combined spend across the two labs last week. That single model is the largest reason OpenAI crossed 50%. And yes, it’s only been two weeks and sure, this could all flip in down the road, but the trend has been compounding for months now.
The GPT 5.6 family (Luna, Terra, Sol) is now on about equal footing in spend with Opus 5 and Sonnet 5 combined. Luna in particular has held a meaningful slice of spend since its early July launch which is all the more impressive given its basement price point.
On the Anthropic side, Fable 5.1 sits at a more muted 7% of combined spend in its third full week. The Fable family of models has had to combat a few issues at launch, namely some blowback for an aggressive data retention policy at first coupled with a very public requirement to pull Fable from the market (see weeks of June 15 and 22) by the current administration.
Where the tokens are going: GPT 5.6 Luna
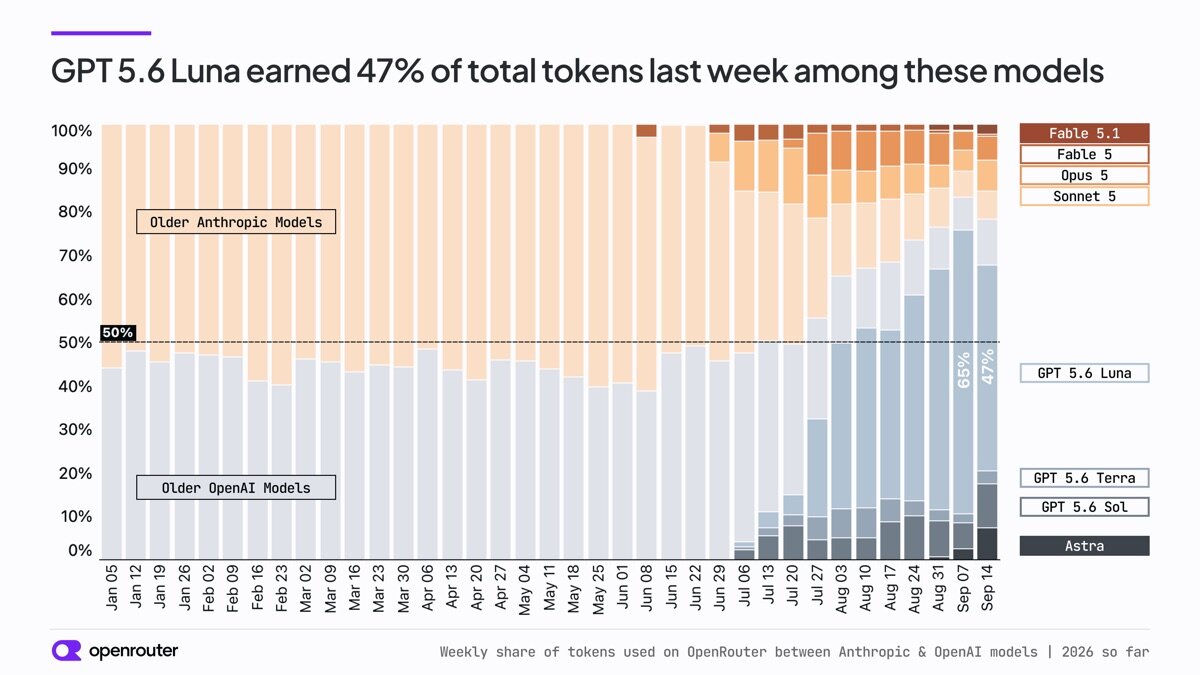
On tokens, one model dominates. GPT 5.6 Luna took 47% of combined OpenAI and Anthropic token volume in the week of Sep 14 - and has been as high as 65% of spend in prior weeks. Important to note that Luna was deeply discounted over this period (a 50% discount on OpenRouter starting July 27th plus an additional cut in list-price by OpenAI itself). However, those price adjustments wrapped up on Aug 14 and the tokens continued to flow.
The introduction of a high-volume, low-price workhorse, coupled with a high-price frontier model, seems to have made a major positive impact for OpenAI on both measured fronts.
Of course the crucial dynamics are not limited to these two major players.
Model movement
Closed-weight labs still hold the lions share of spend
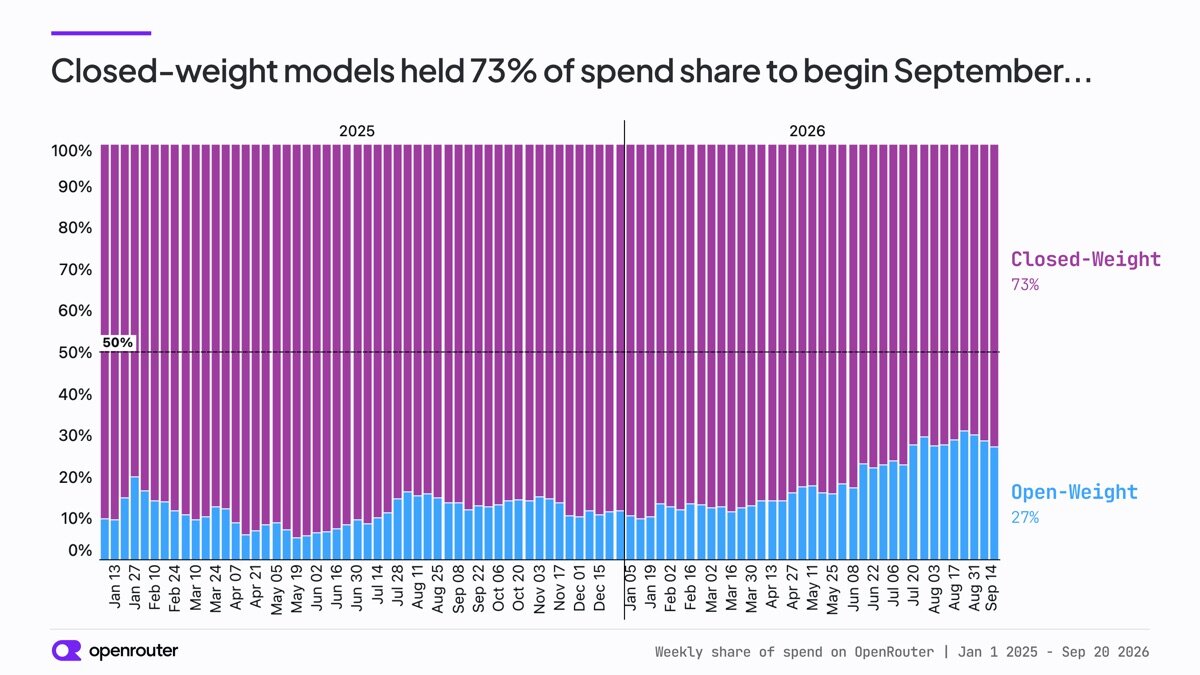
The OpenAI versus Anthropic race, high-stakes though it may be, is only one fight for share in a massively expanding market. Closed weight models (from about 30 different labs, though dominated by the big 2 labs plus Google) saw 73% of spend in the second week of September as opposed to 89% the week of Jan 5.
In tokens, the flip has already happened
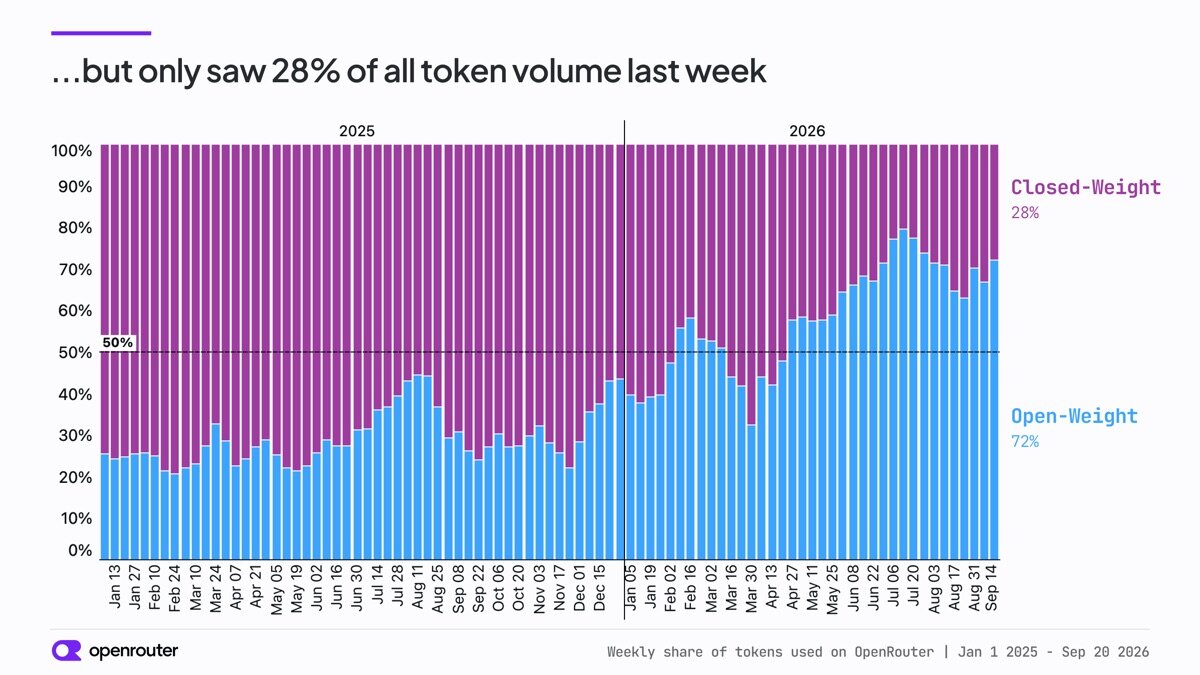
Open-weight model token share crossed 50% of tokens briefly in February and more permanently in April of this year It reached 79% in early July, its high point, and has held above 62% since.
When the capabilities of the open-weight models trailed the frontier models by a greater distance, cost comparison was less realistic. But many different model labs have produced highly capable models in recent months, often approaching the benchmark scores of frontier models at a fraction of the cost, and organizations are taking note. Just one example - over 40% of US startups on OpenRouter now use DeepSeek in production. A comparable figure back in January was around 13%.
Chinese labs lead the open-weight wave
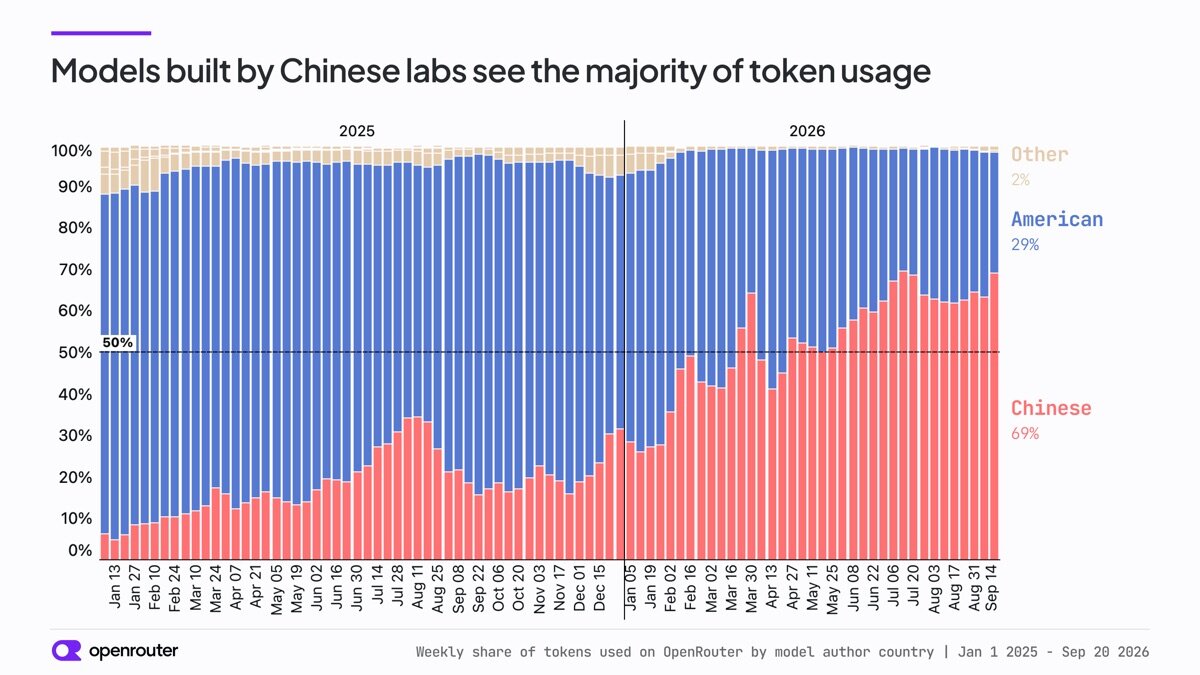
The Venn diagram of open-weight models and those produced by Chinese labs is nearly a perfect overlap. 69% of tokens on OpenRouter last week were from Chinese labs (vs 72% being open-weight overall).
The share of tokens for labs outside of the US and China has been shrinking for months. The rest of the world saw nearly 12% of weekly tokens to being 2025 and now makes do with only 2%.
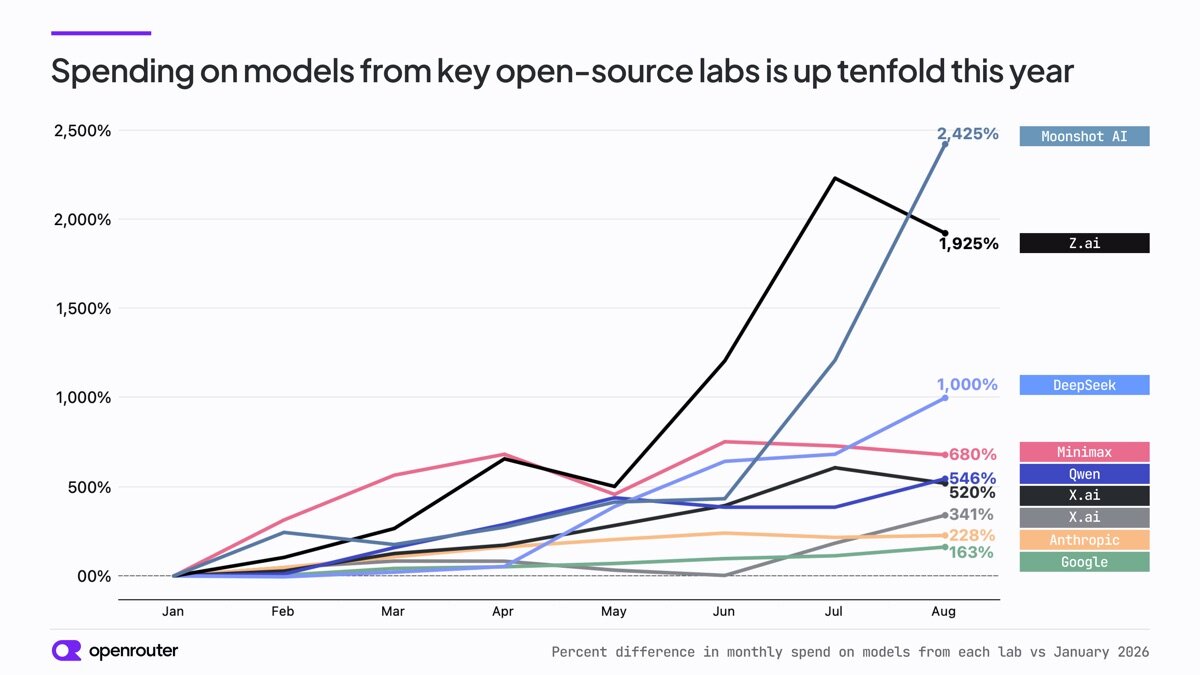
Alright - so frontier, closed-weight labs make the money while open-weight competition eats the tokens, right?
Not so fast. 3 key open-weight labs have seen their monthly spend increase tenfold or more from January to August 2026 (Moonshot AI, Z.ai, and DeepSeek). When viewed as a percentage of all spend the three labs are still only in the high single digits, but the growth rates are impressive.
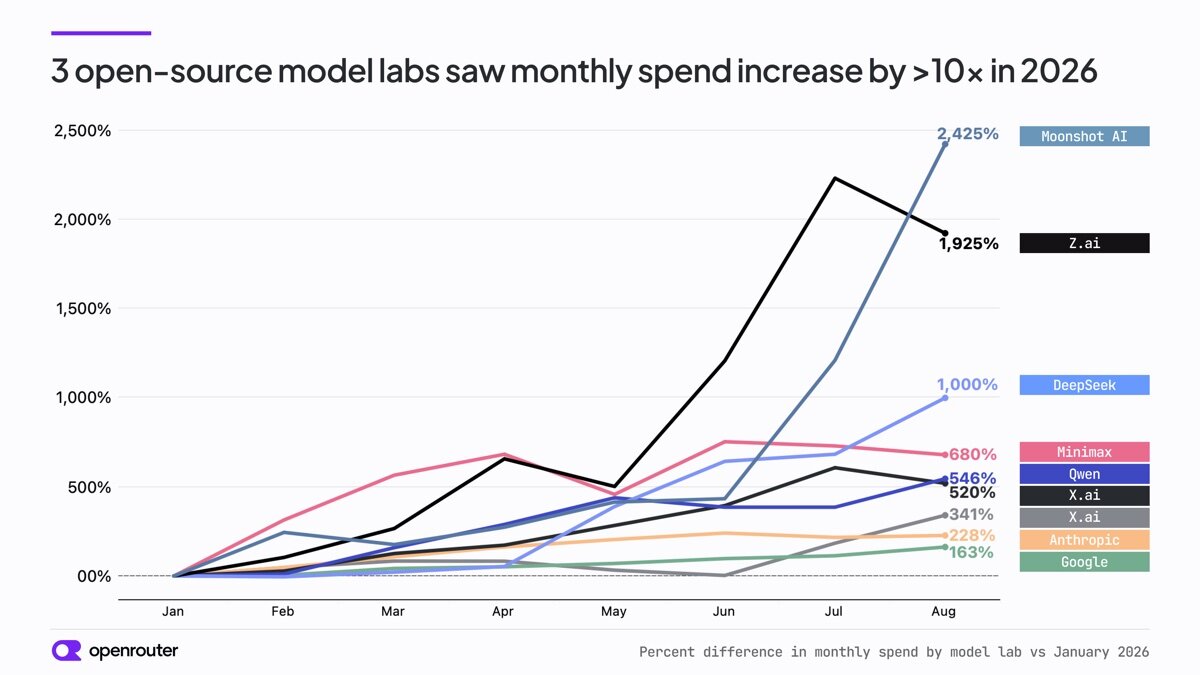
Which brings us back to the first point - it’s important to keep in mind just how fast this whole market is expanding. If and when the tokens continue on their exponential path, many flowers will bloom. Here’s to model diversity.
Thanks for reading this inaugural edition of Inferred - we’ll see you next week!
Onwards,
Peter
All figures are weekly totals from OpenRouter usage data, Jan 1, 2025 through Sep 20, 2026. Share charts are computed within the segment named in each chart's footer. All charts exclude reseller activity.